News & Insights
17 analyses and insights.
Markets and companies, in charts
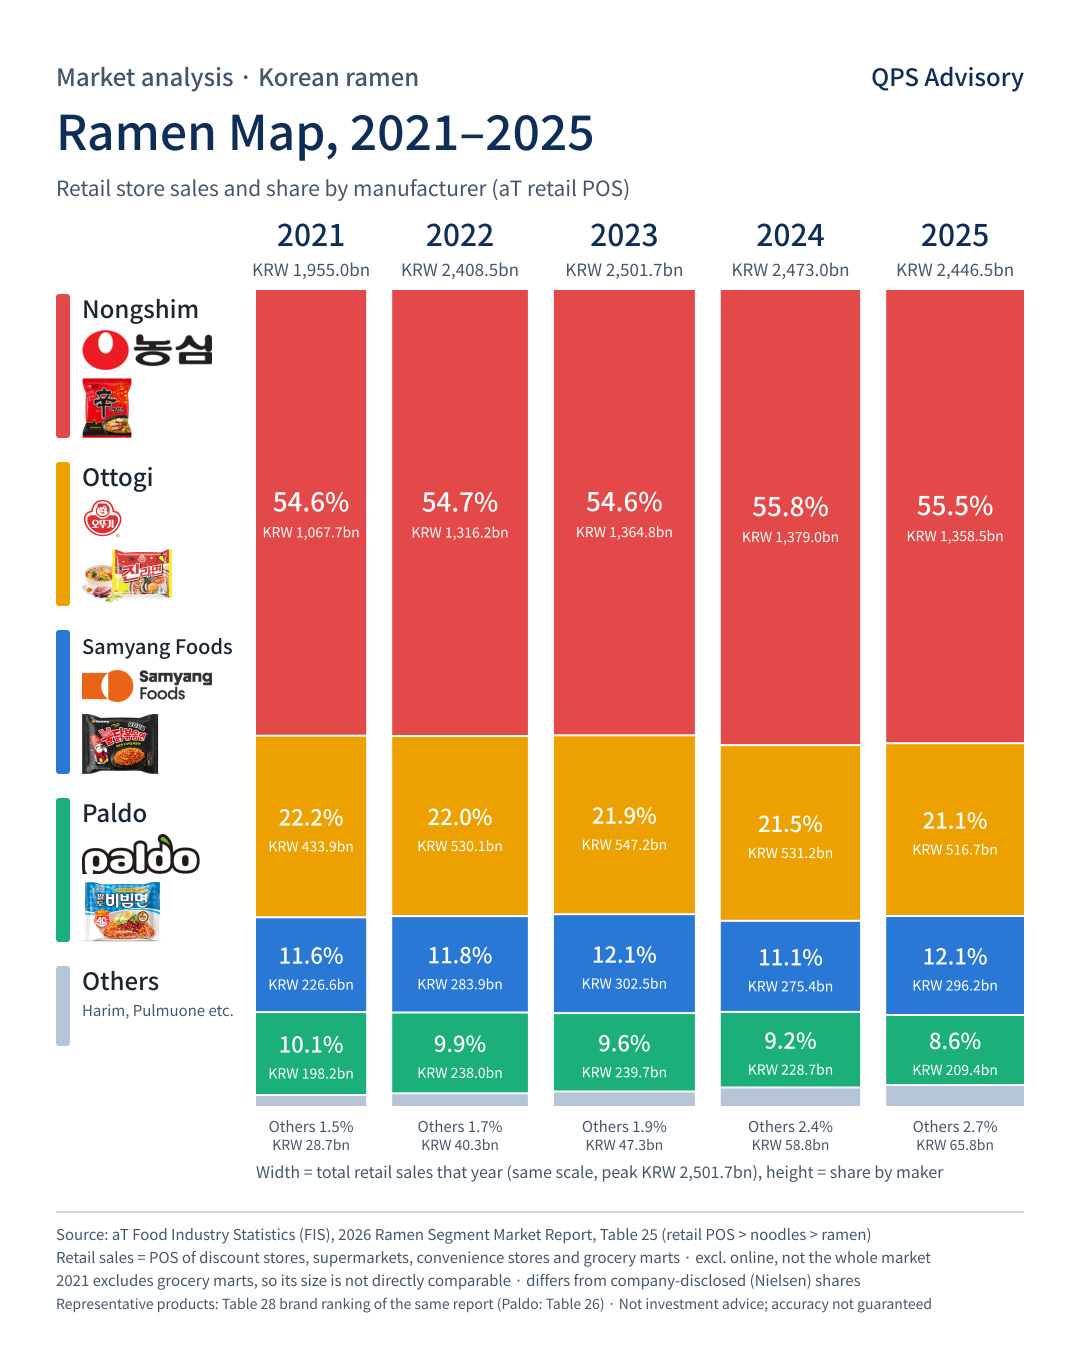 Korea's Ramen Market, 2021–2025
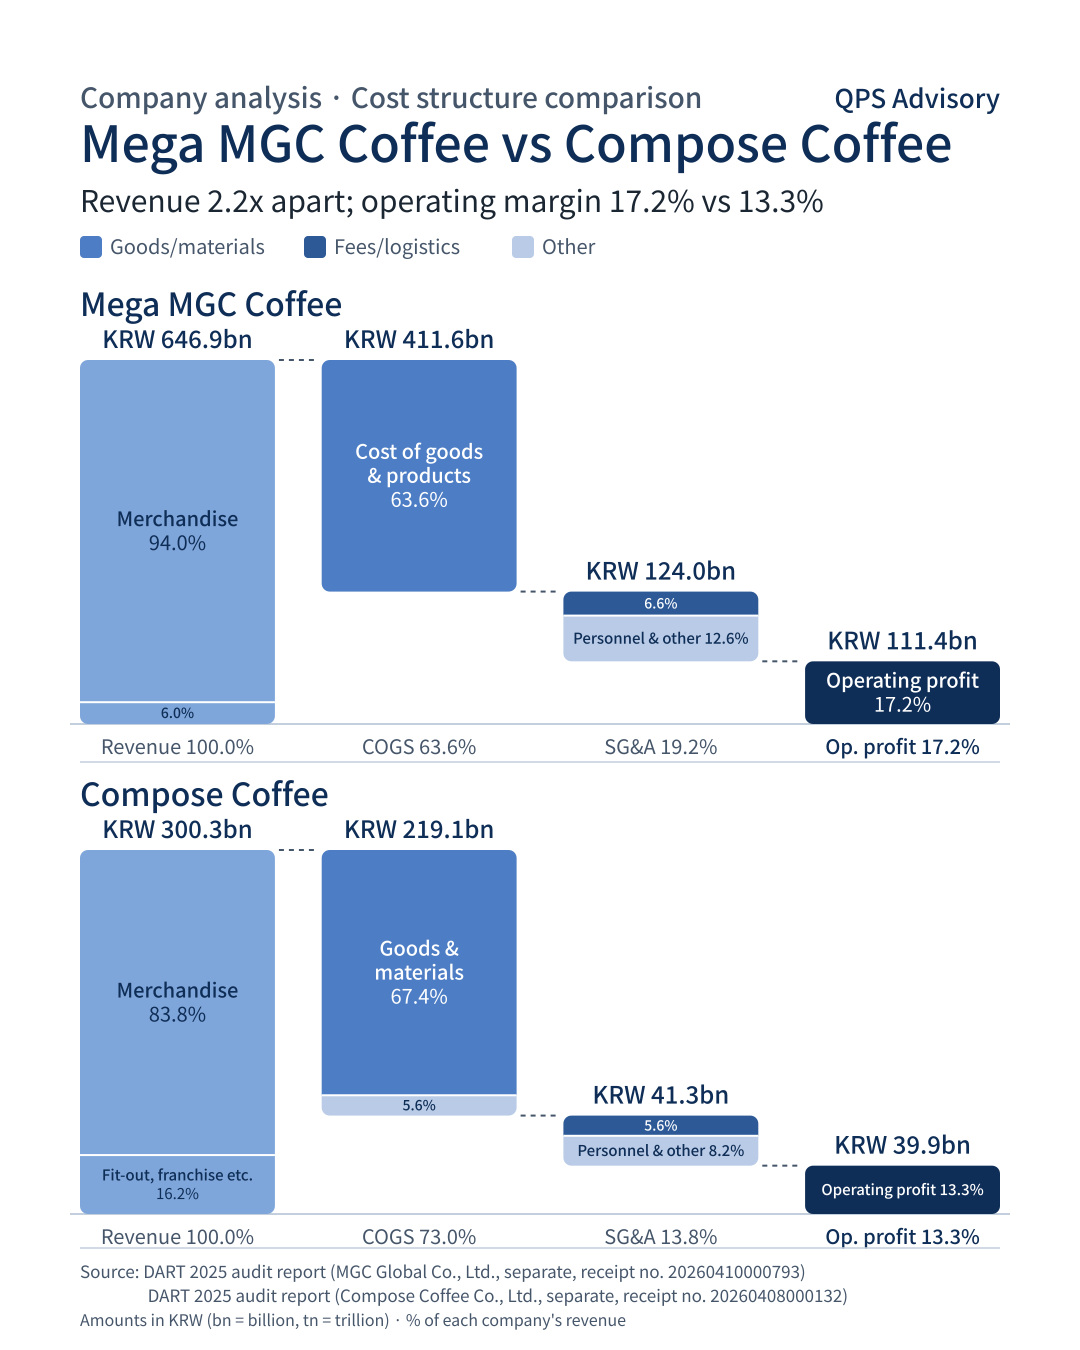 Mega MGC Coffee vs Compose Coffee
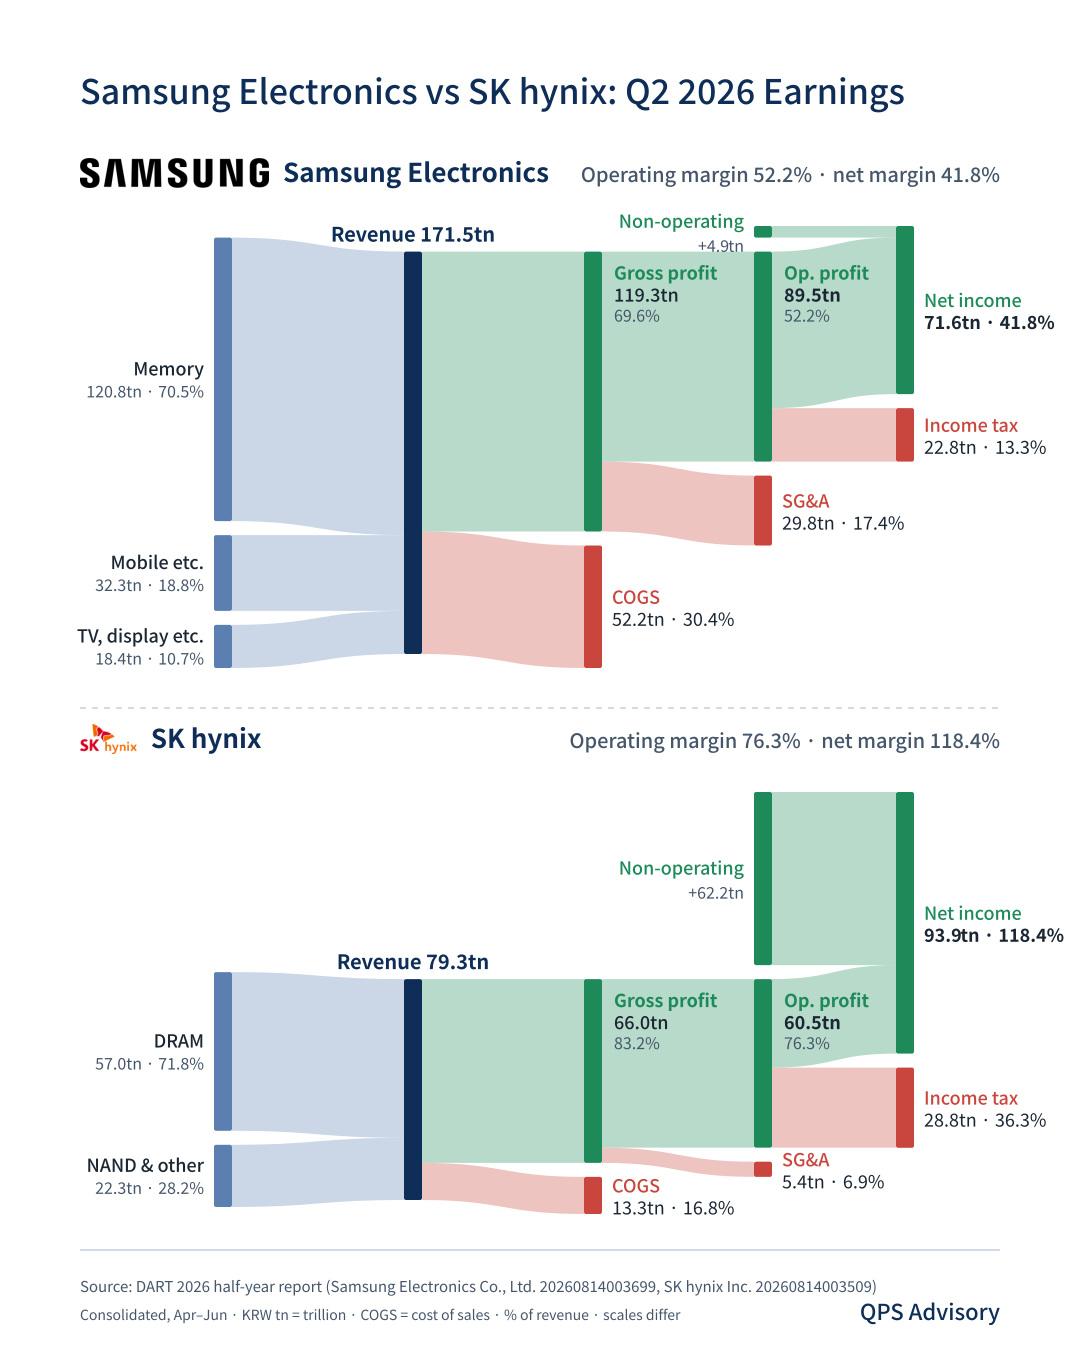 Samsung Electronics vs SK hynix, Q2 2026
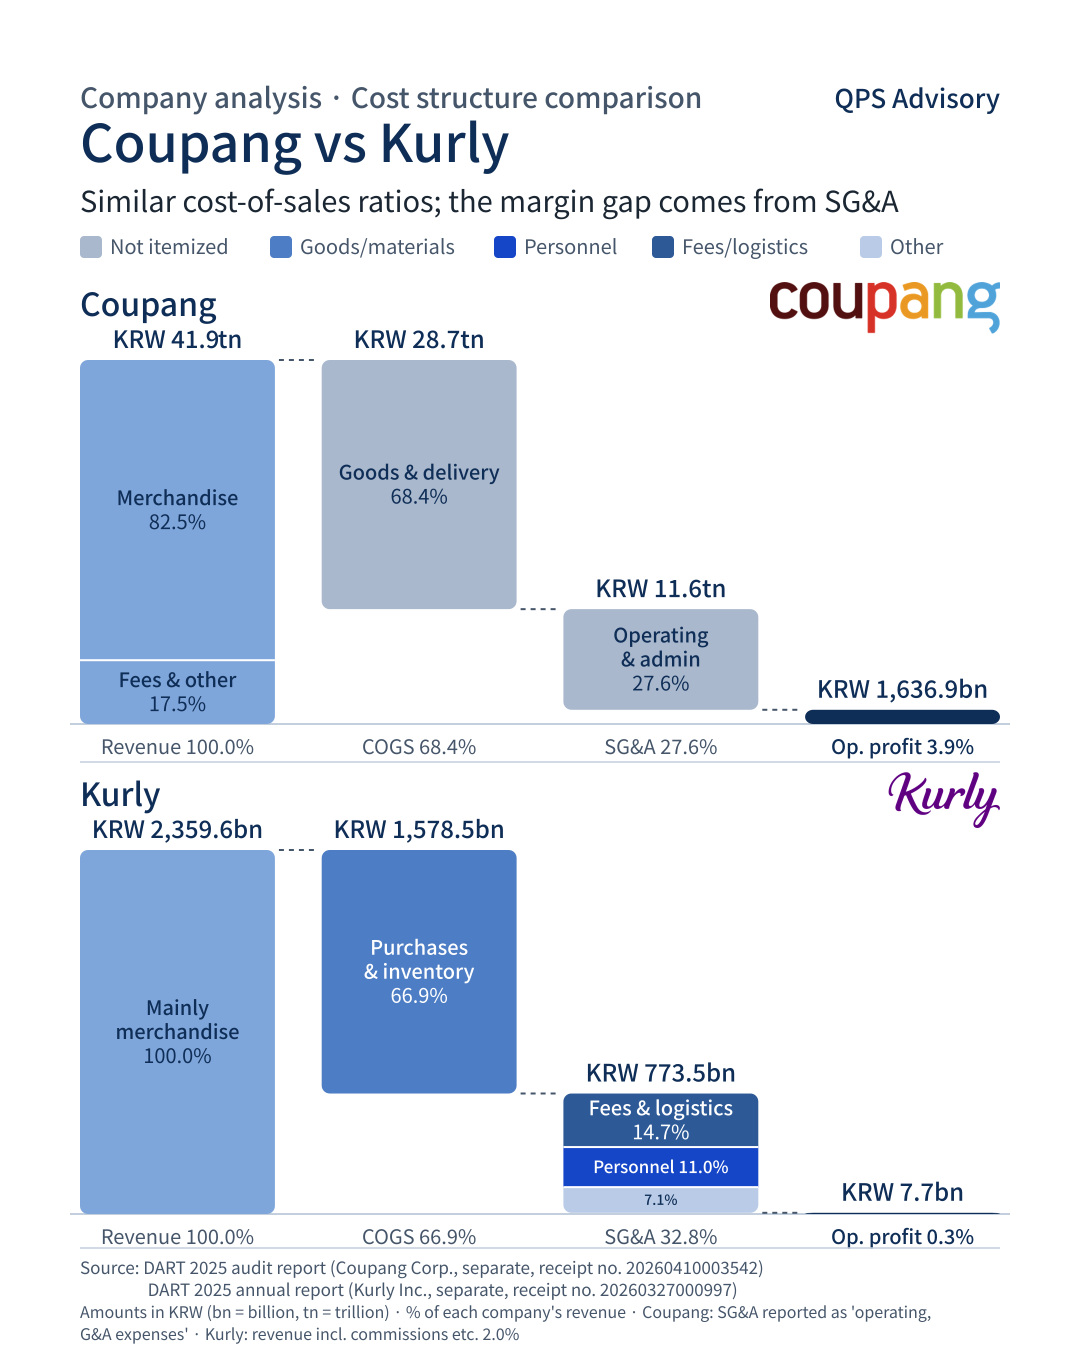 Coupang vs Kurly
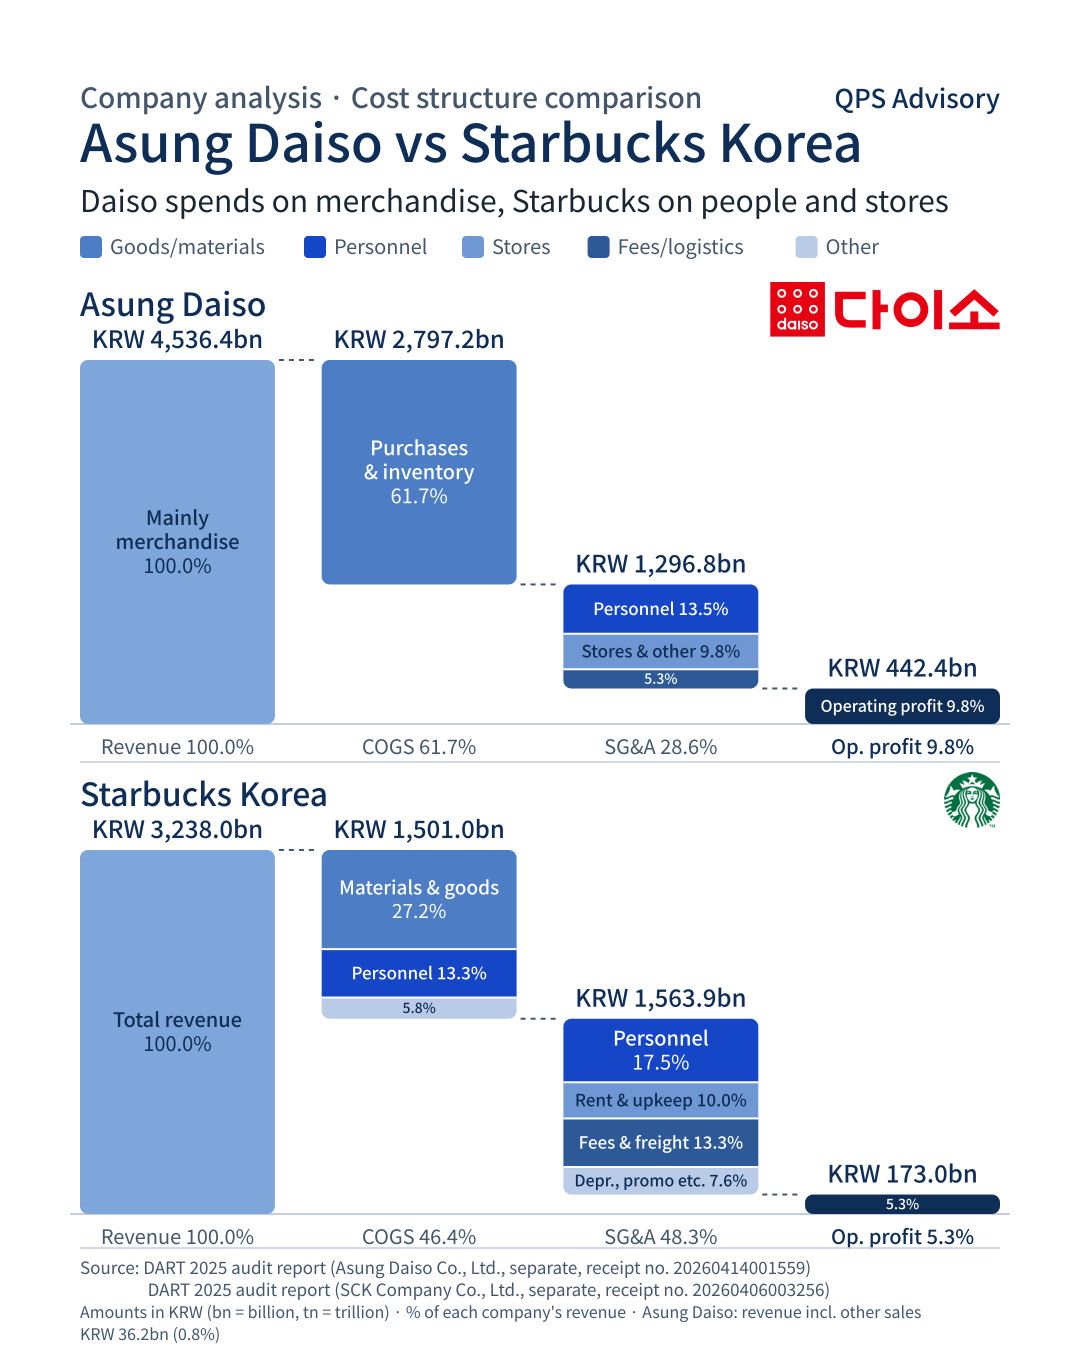 Asung Daiso vs Starbucks Korea
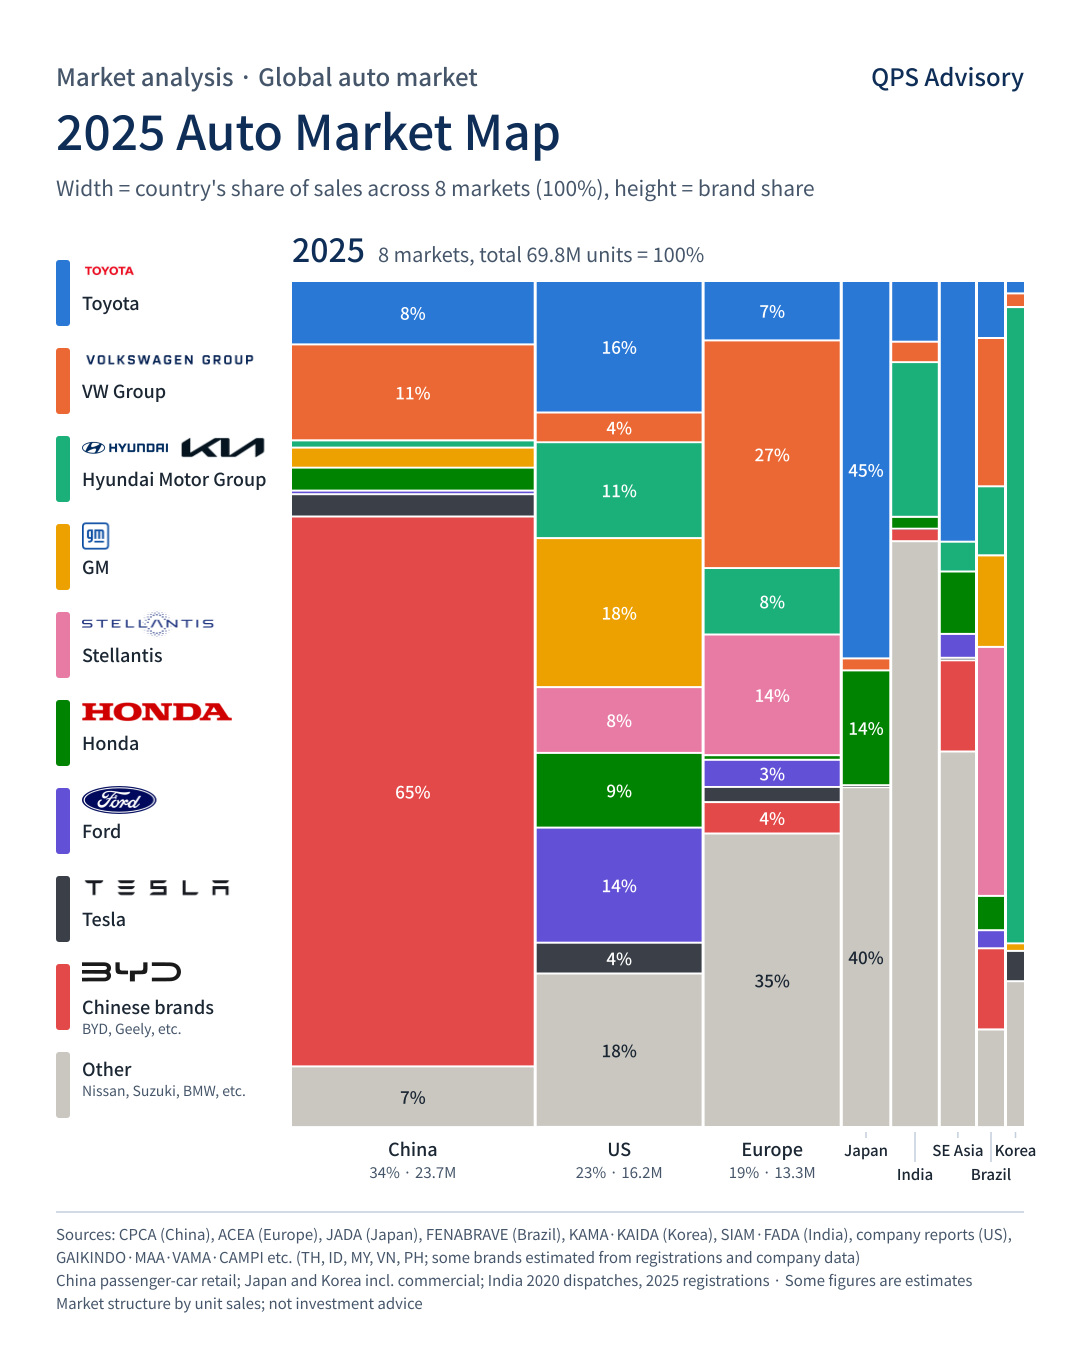 The Global Auto Market Map, 2010, 2020 and 2025
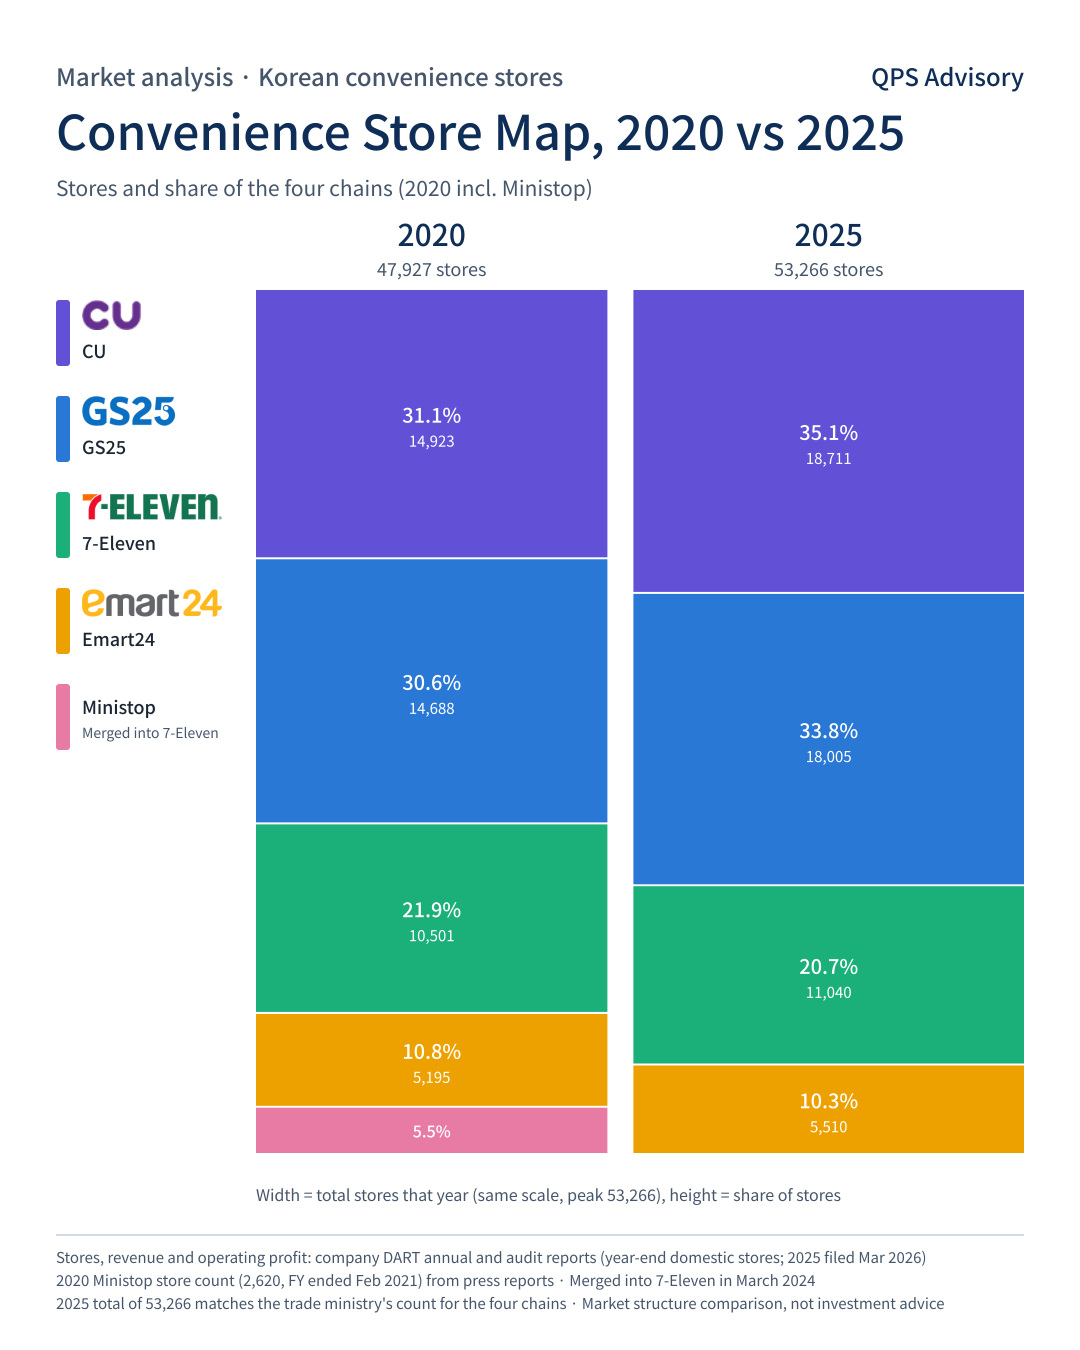 Korea's Convenience Store Map, 2008–2025
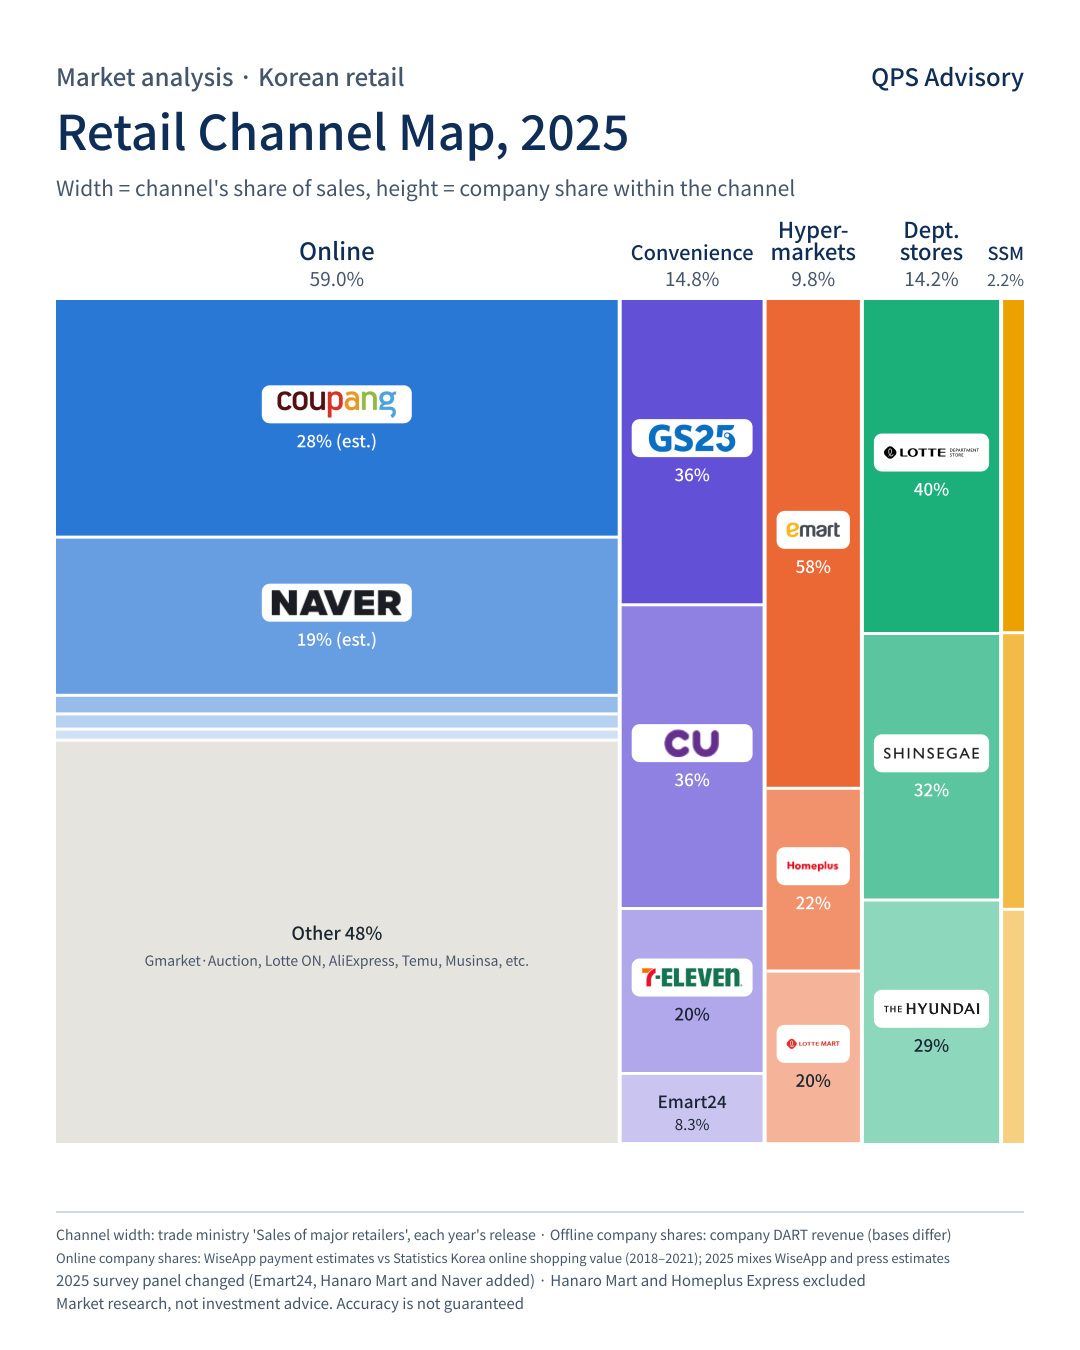 Korea's Retail Channel Map, 2015–2025
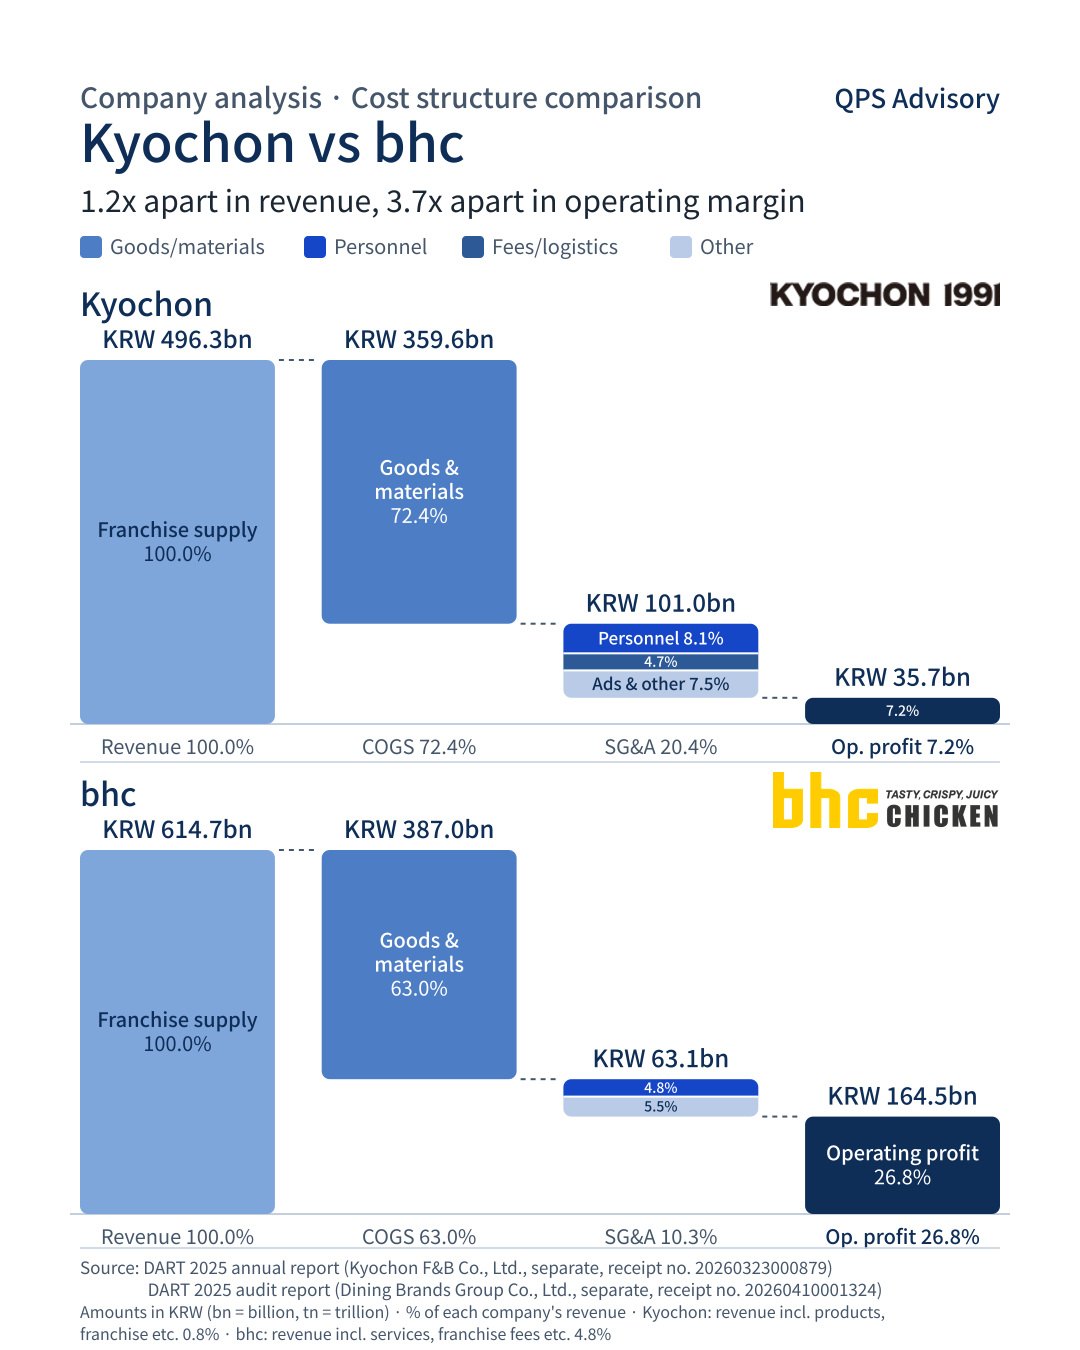 Kyochon vs bhc
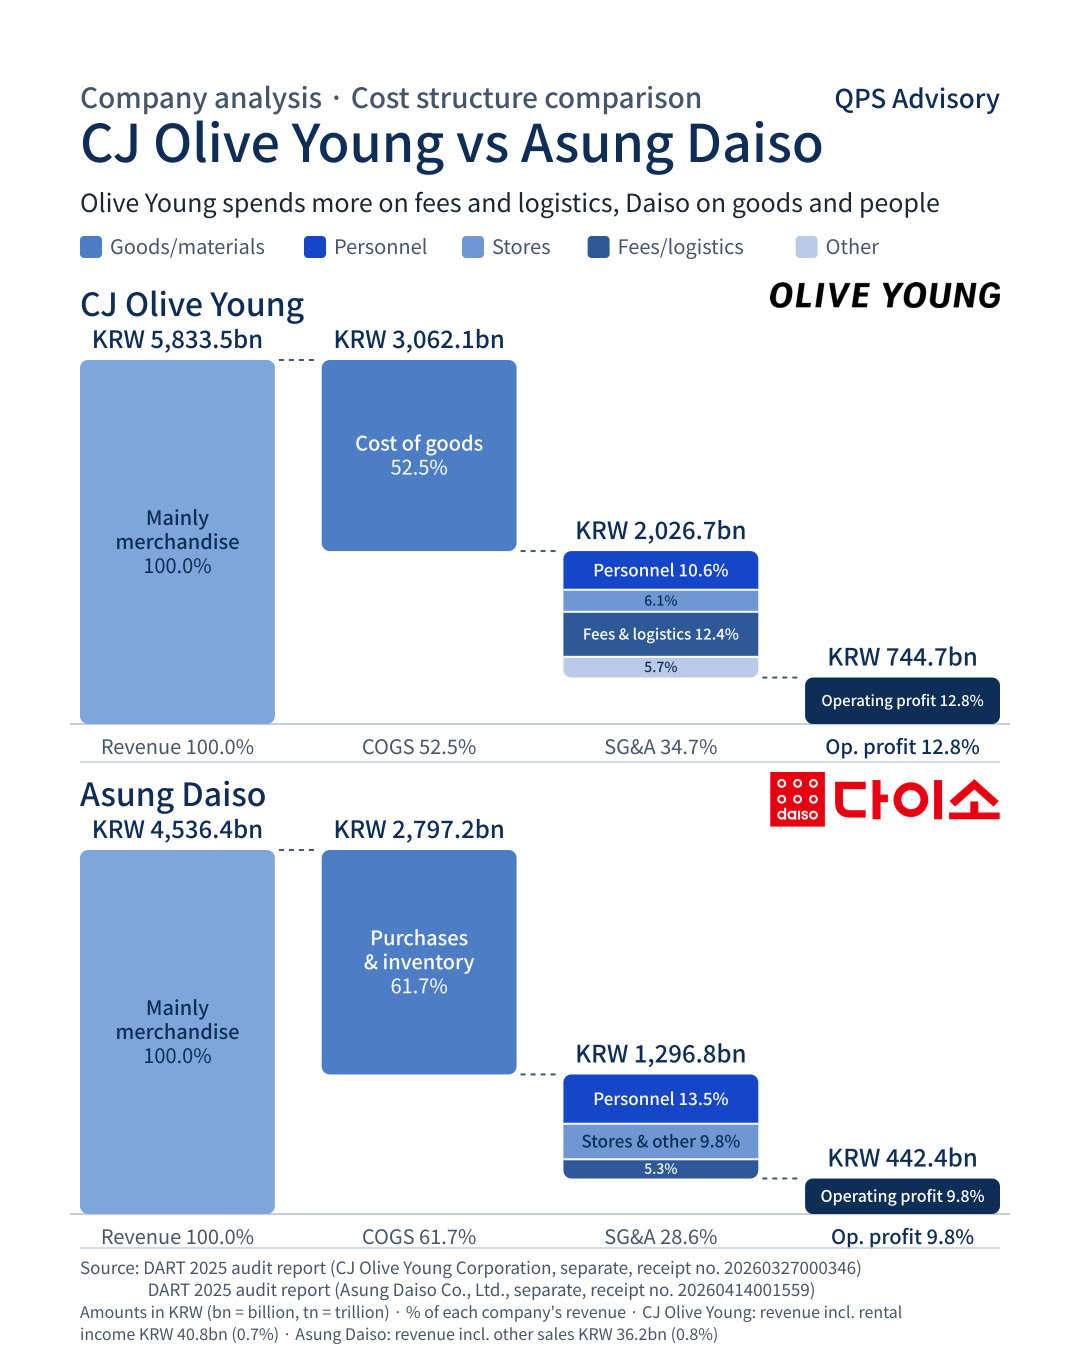 Olive Young vs Daiso
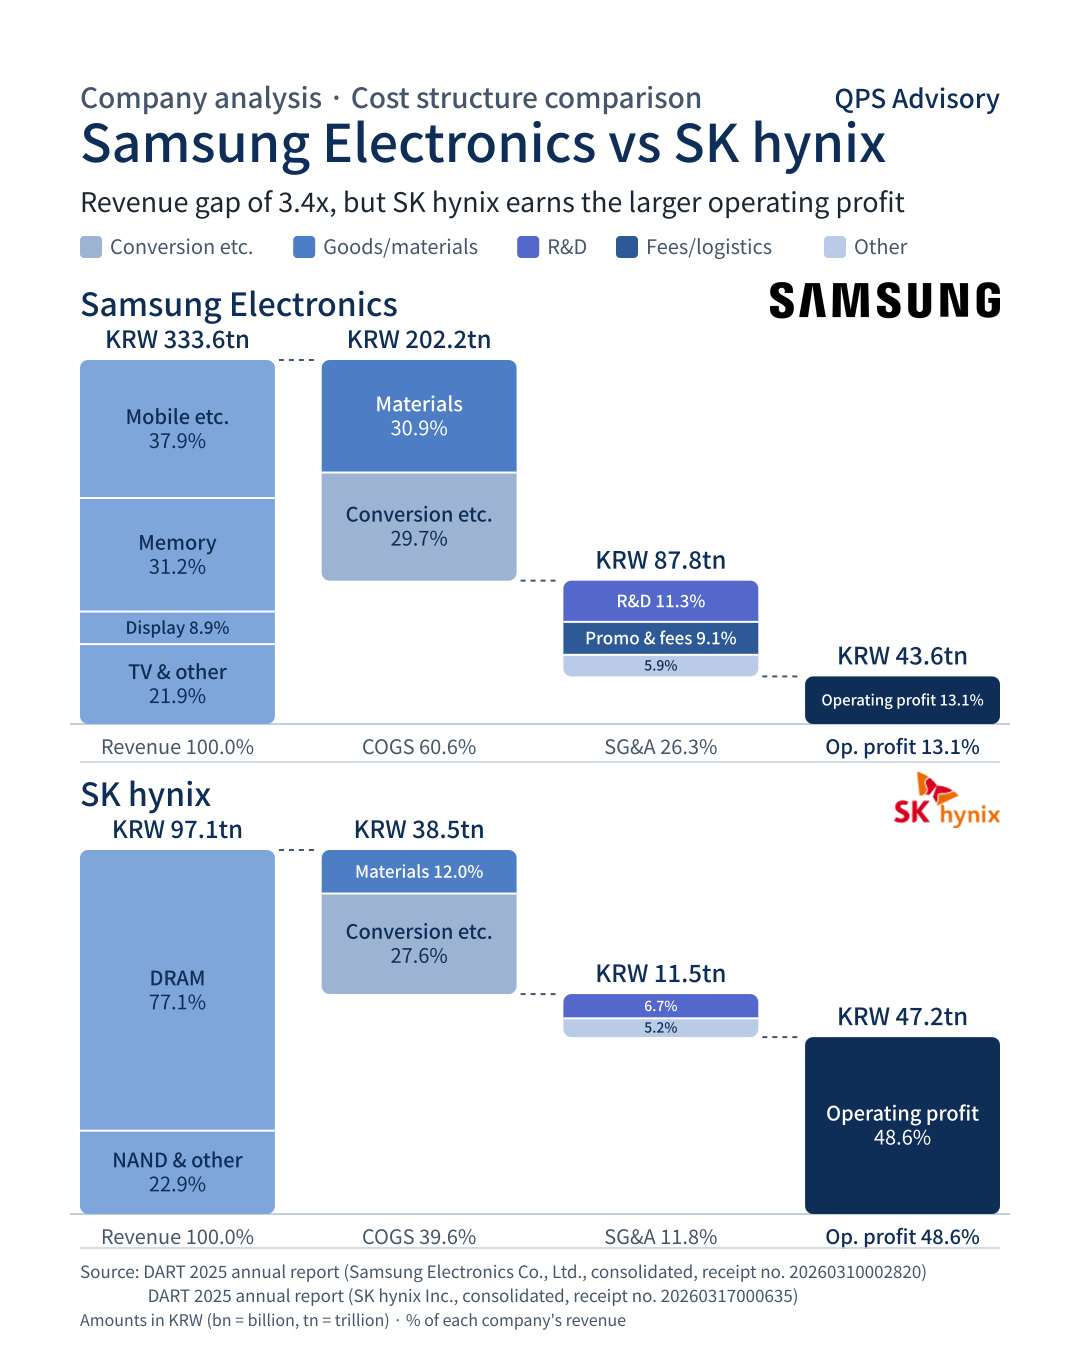 Samsung Electronics vs SK hynix
Korea's Ramen Market, 2021–2025: Flat Shares, Widening Gaps in Revenue and Profit
Nongshim, Ottogi, Samyang Foods and Paldo compared using aT retail sales, customs export data and DART filings.
Mega MGC Coffee vs Compose Coffee: 2.2x Apart in Revenue, 2.8x Apart in Operating Profit
Using 2025 audit reports, we compared where each company's revenue went.
Samsung Electronics vs SK hynix, Q2 2026: SK hynix's Net Income Exceeded Its Revenue
We traced how three-month (April–June) results in the 2026 half-year reports (consolidated) flowed from revenue to net income.
Coupang vs Kurly: Similar Cost-of-Sales Ratios, an Operating Margin Gap Driven by SG&A
Using their 2025 audit report and annual business report, we compared where each company's revenue went.
Asung Daiso vs Starbucks Korea: Daiso Spends on Merchandise, Starbucks Spends on People and Stores
We compared where each company's revenue went, based on their 2025 audit reports and business reports.
The Global Auto Market Map, 2010, 2020 and 2025: Chinese Brands Doubled Their Share in Five Years
New-vehicle sales in eight markets by country and brand group.
Korea's Convenience Store Map, 2008–2025: 4x the Stores, a Big Two, and Two Years of Decline
Store-count shares over 18 years and 2025 revenue and operating profit, from DART filings.
Korea's Retail Channel Map, 2015–2025: Online at 59%, Coupang on Top, Hypermarkets in Retreat
Channel shares from the trade ministry and company shares from DART and WiseApp show a decade of change.
Kyochon vs bhc: 1.2x Apart in Revenue, 3.7x Apart in Operating Margin
Using 2025 audit reports and annual reports, we compared where each company's revenue went.
Olive Young vs Daiso: Same Retail Model, Different Cost Structures
Where each company's 2025 revenue went, from their audit reports.
Samsung Electronics vs SK hynix: 3.4x Gap in Revenue, but SK hynix Has the Larger Operating Profit
We used the 2025 audit reports and annual reports to compare where each company's revenue went.
A Buyer's "Ability to Finance" Matters as Much as Price and Structure
Whose money funds the acquisition shapes both the likelihood of closing and the burden on the company after the acquisition. What sellers should check before choosing the higher price.
A Price With an Earn-out Is a Condition, Not a Promised Amount
How much of the headline amount is fixed cash, and how much depends on future performance? Checkpoints for sellers, drawn from the UK Winvia deal and the Doosan–SK Siltron earn-out.
Just as Important as Who the CEO Is: How the Company Runs Without the CEO
Founder dependence is assessed differently by industry and is reflected directly in price and deal structure. What owners preparing for a succession-driven sale should build first.
A Sale Agreement Ends with the Final Payment, Not the Signature
What a seller needs to secure between signing and closing, seen through a listed company whose buyer changed twice after signing and whose final payment deadline slipped to year-end.
Becoming the Buyer's Creditor and Shareholder as the Price of Selling Your Company
Of the £23.55m headline, cash at completion is 17%. The risks of loan note and share consideration, and how sellers can check them, as seen in the UK EARNZ–GEM deal.
K-Beauty M&A 2025–2026: Private Equity Builds the Value Chain
Ten deals from ODMs and packaging to brands and medical aesthetics show who is buying K-beauty, the deal structures they use and the prices they pay.