Olive Young vs Daiso: Same Retail Model, Different Cost Structures
Where each company's 2025 revenue went, from their audit reports.
Olive Young and Daiso both buy goods and resell them, but they spend their money differently. Olive Young spends more on fees and logistics; Daiso spends more on goods and people. We compared their cost structures using 2025 audit reports (standalone financial statements) filed on DART, Korea’s corporate disclosure system.
USD figures are converted at KRW 1,450 = USD 1.
1. At a glance
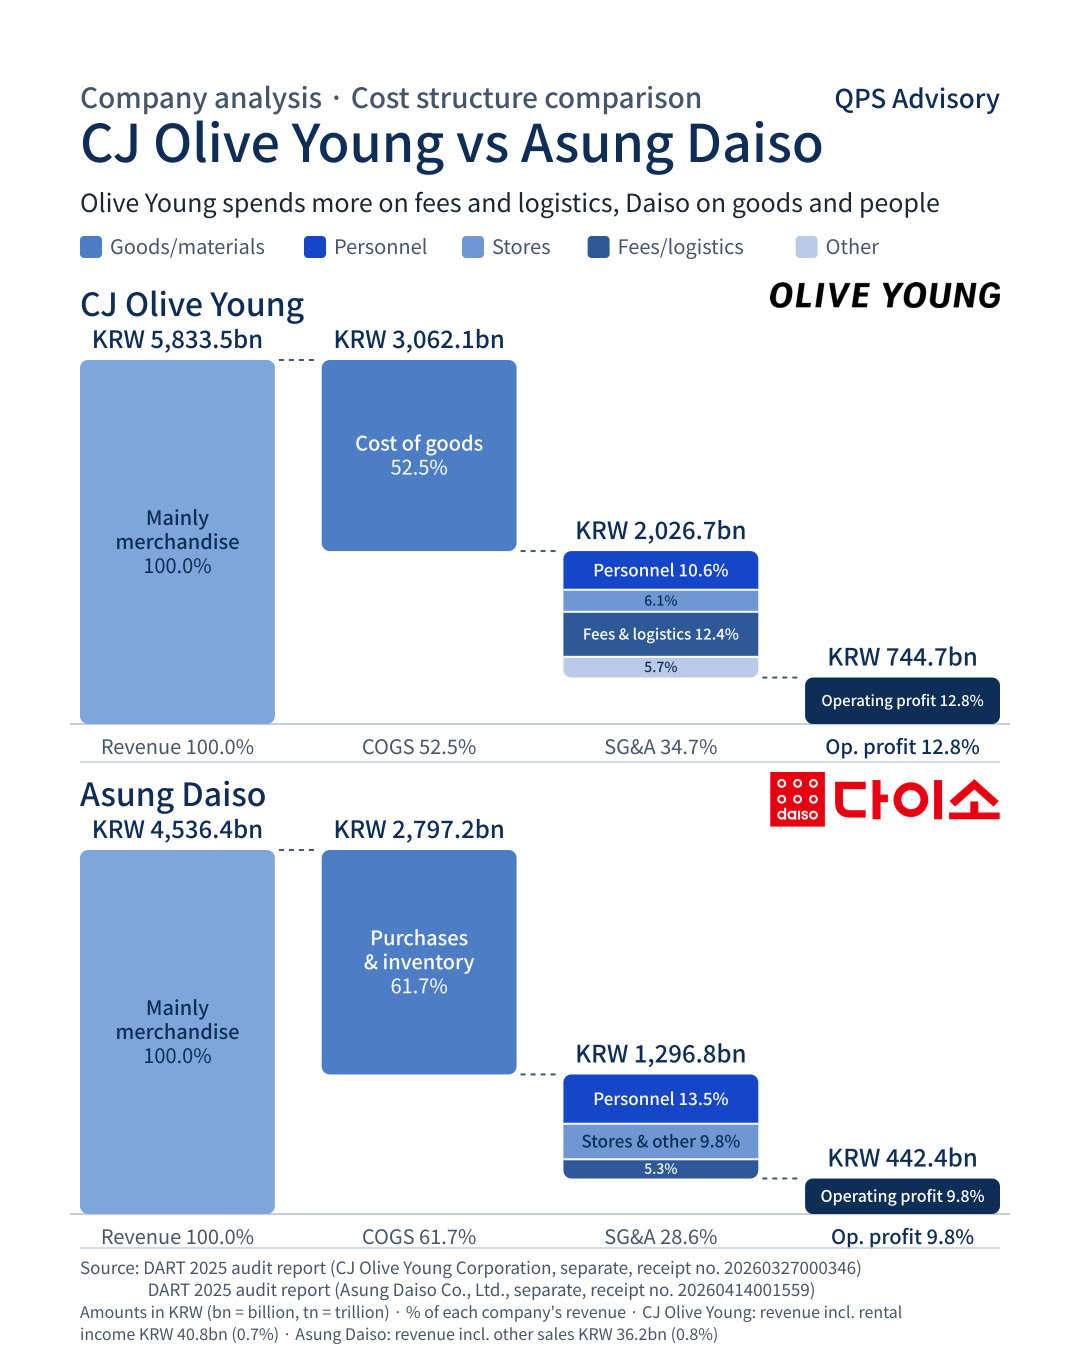
- Olive Young is 1.3x larger by revenue: $4bn vs $3.1bn
- Cost of goods ratio: Daiso 61.7%, Olive Young 52.5%
- Fees and logistics, more than 2x at Olive Young: 12.4% vs 5.3%
- Labour is higher at Daiso: 13.5% vs 10.6%
- Operating margin: Olive Young 12.8%, Daiso 9.8%
2. Olive Young: a fees-and-logistics business
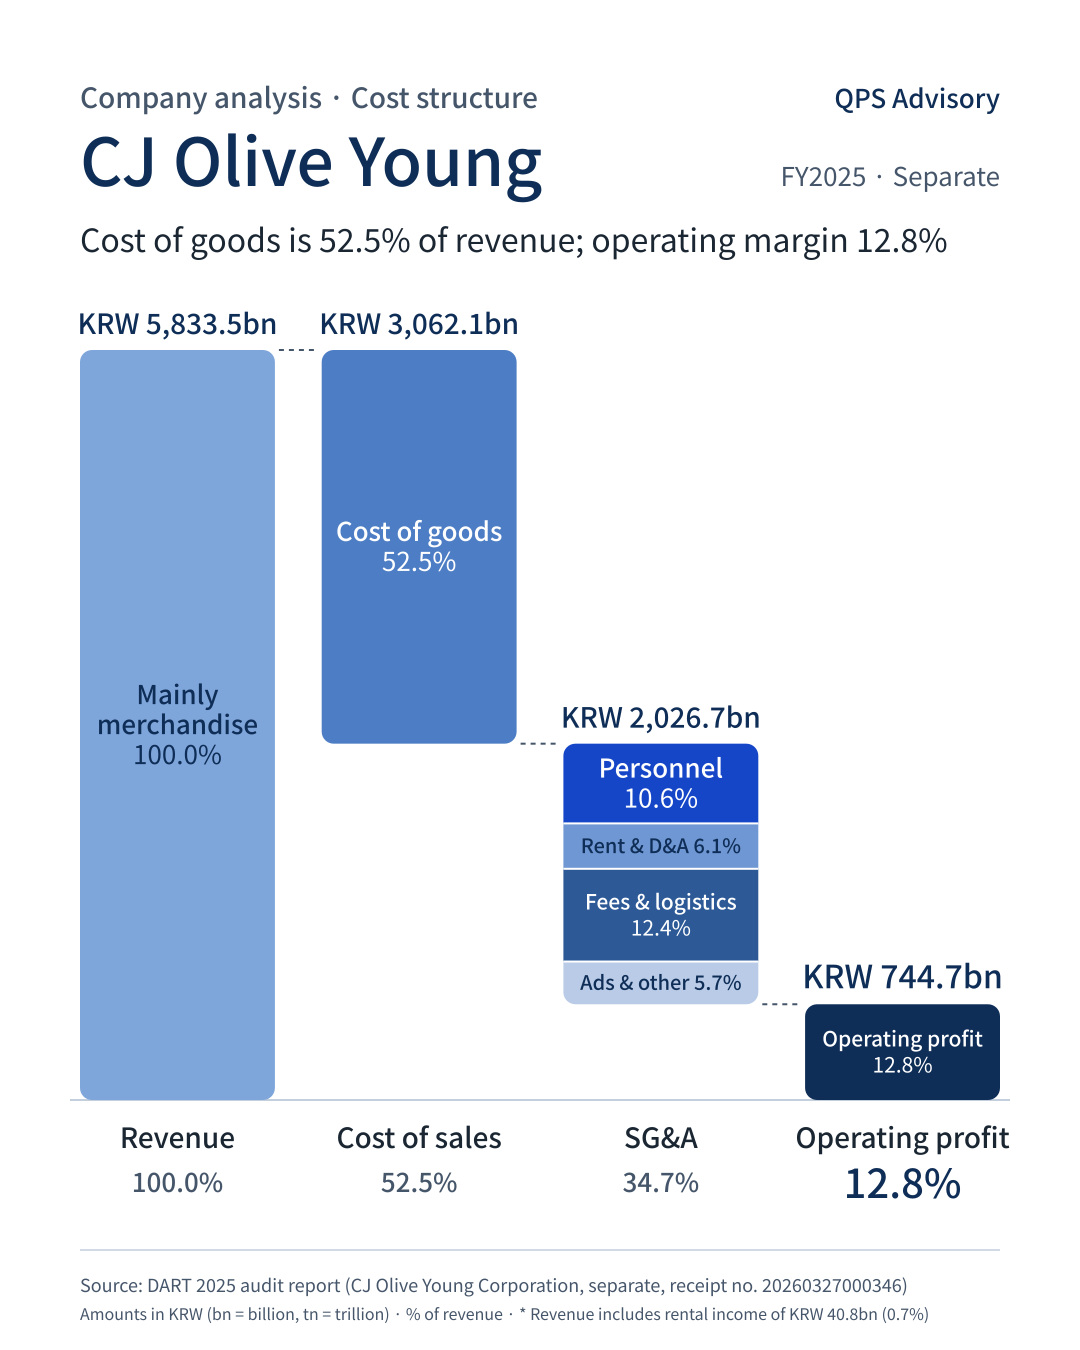
Of every KRW 100 of revenue, 52.5 went to cost of goods, 10.6 to labour, 6.1 to rent and depreciation, 12.4 to fees and logistics, and 5.7 to advertising and other costs, leaving 12.8 of operating profit. Compared with Daiso, its cost of goods ratio is 9.2 points lower and its fees and logistics share 7.1 points higher.
3. Daiso: a goods-and-people business
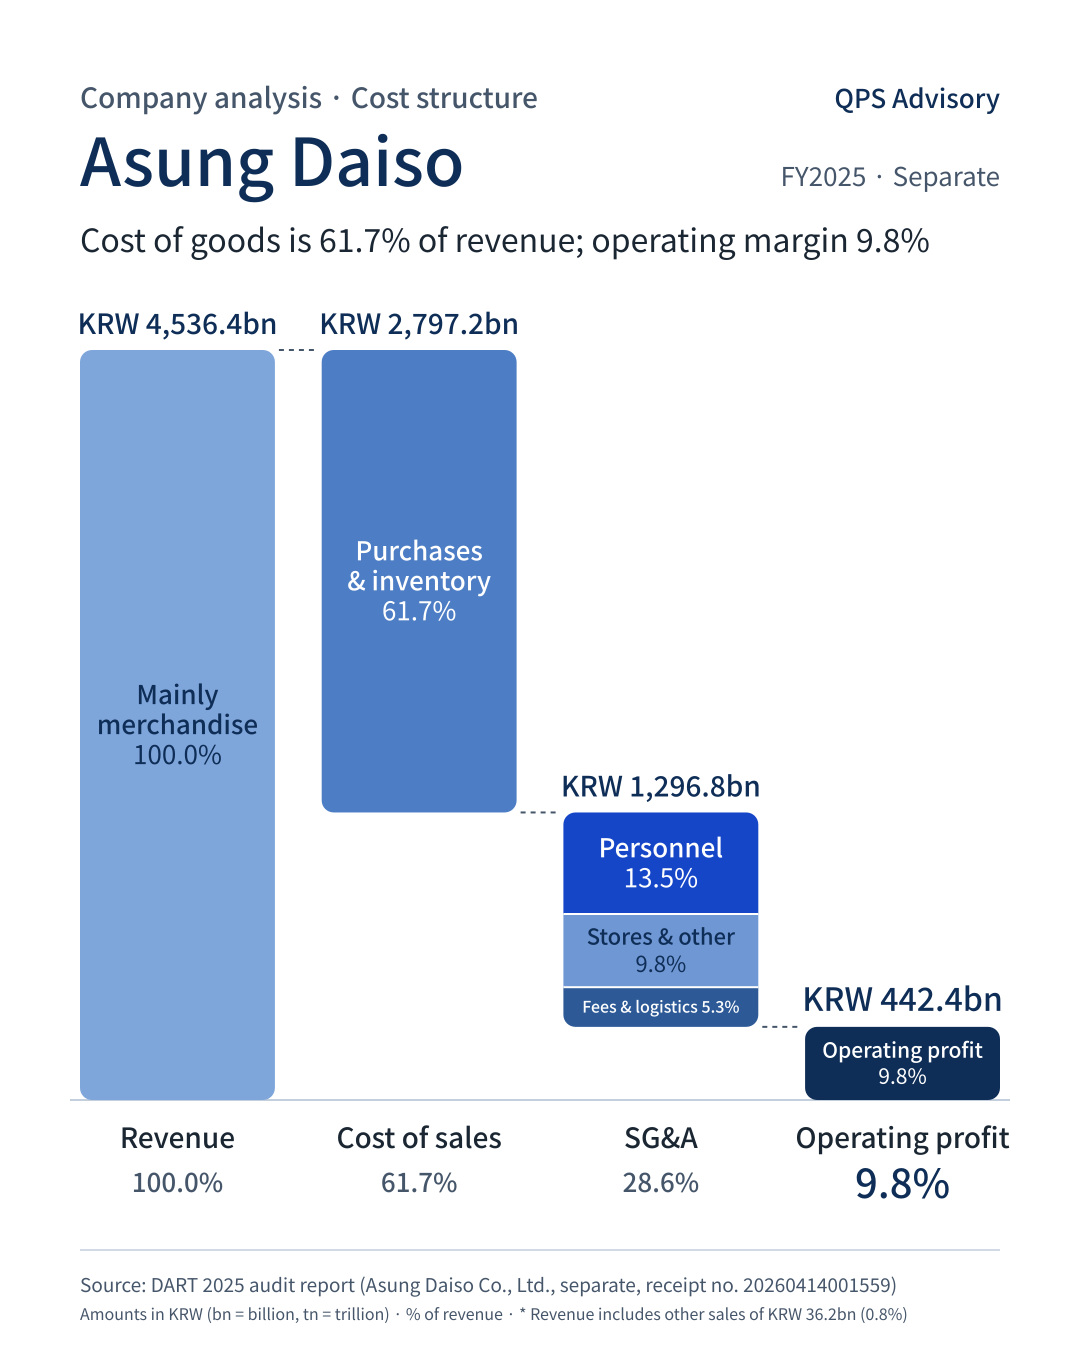
Of every KRW 100 of revenue, 61.7 went to goods and inventory, 13.5 to labour, 9.8 to stores and other costs, and 5.3 to fees and logistics, leaving 9.8 of operating profit. Compared with Olive Young, its cost of goods ratio is 9.2 points higher and its labour share 2.9 points higher.
Limitations
- Both companies are on a standalone basis. Cost lines group similar items from the audit report notes, so the two companies’ categories are not exactly identical.
- Sources: 2025 audit reports on DART (CJ Olive Young receipt no. 20260327000346, Asung Daiso 20260414001559).
Sources are noted on each chart and in the text. This is market research, not investment advice, and its accuracy is not guaranteed.